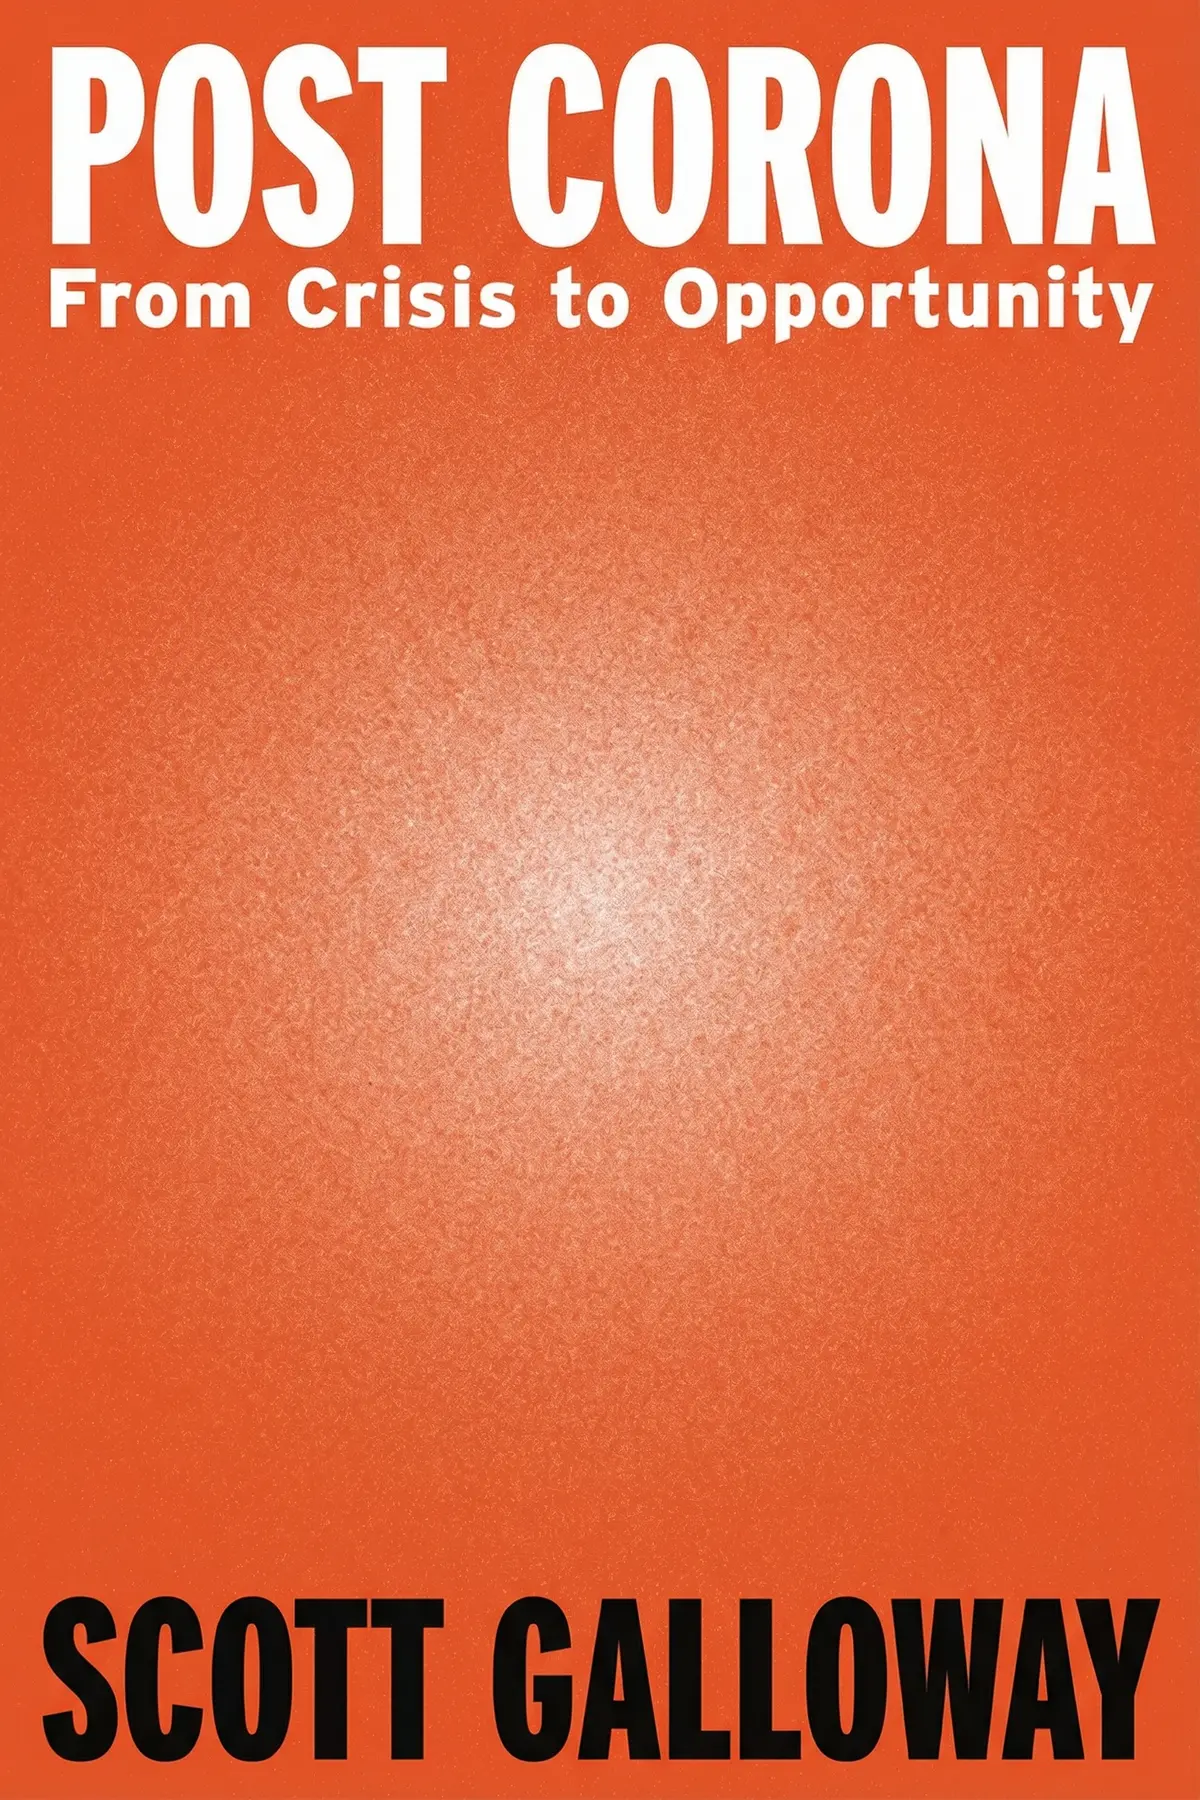
Post Corona: From Crisis to Opportunity
Scott Galloway
 English
Shows, through data, how America moved from building a shared middle class to serving shareholders. That one shift links inequality, costly education, founder worship, angry feeds and lost friendships, and choices can still turn it around.
1 min 19 sec
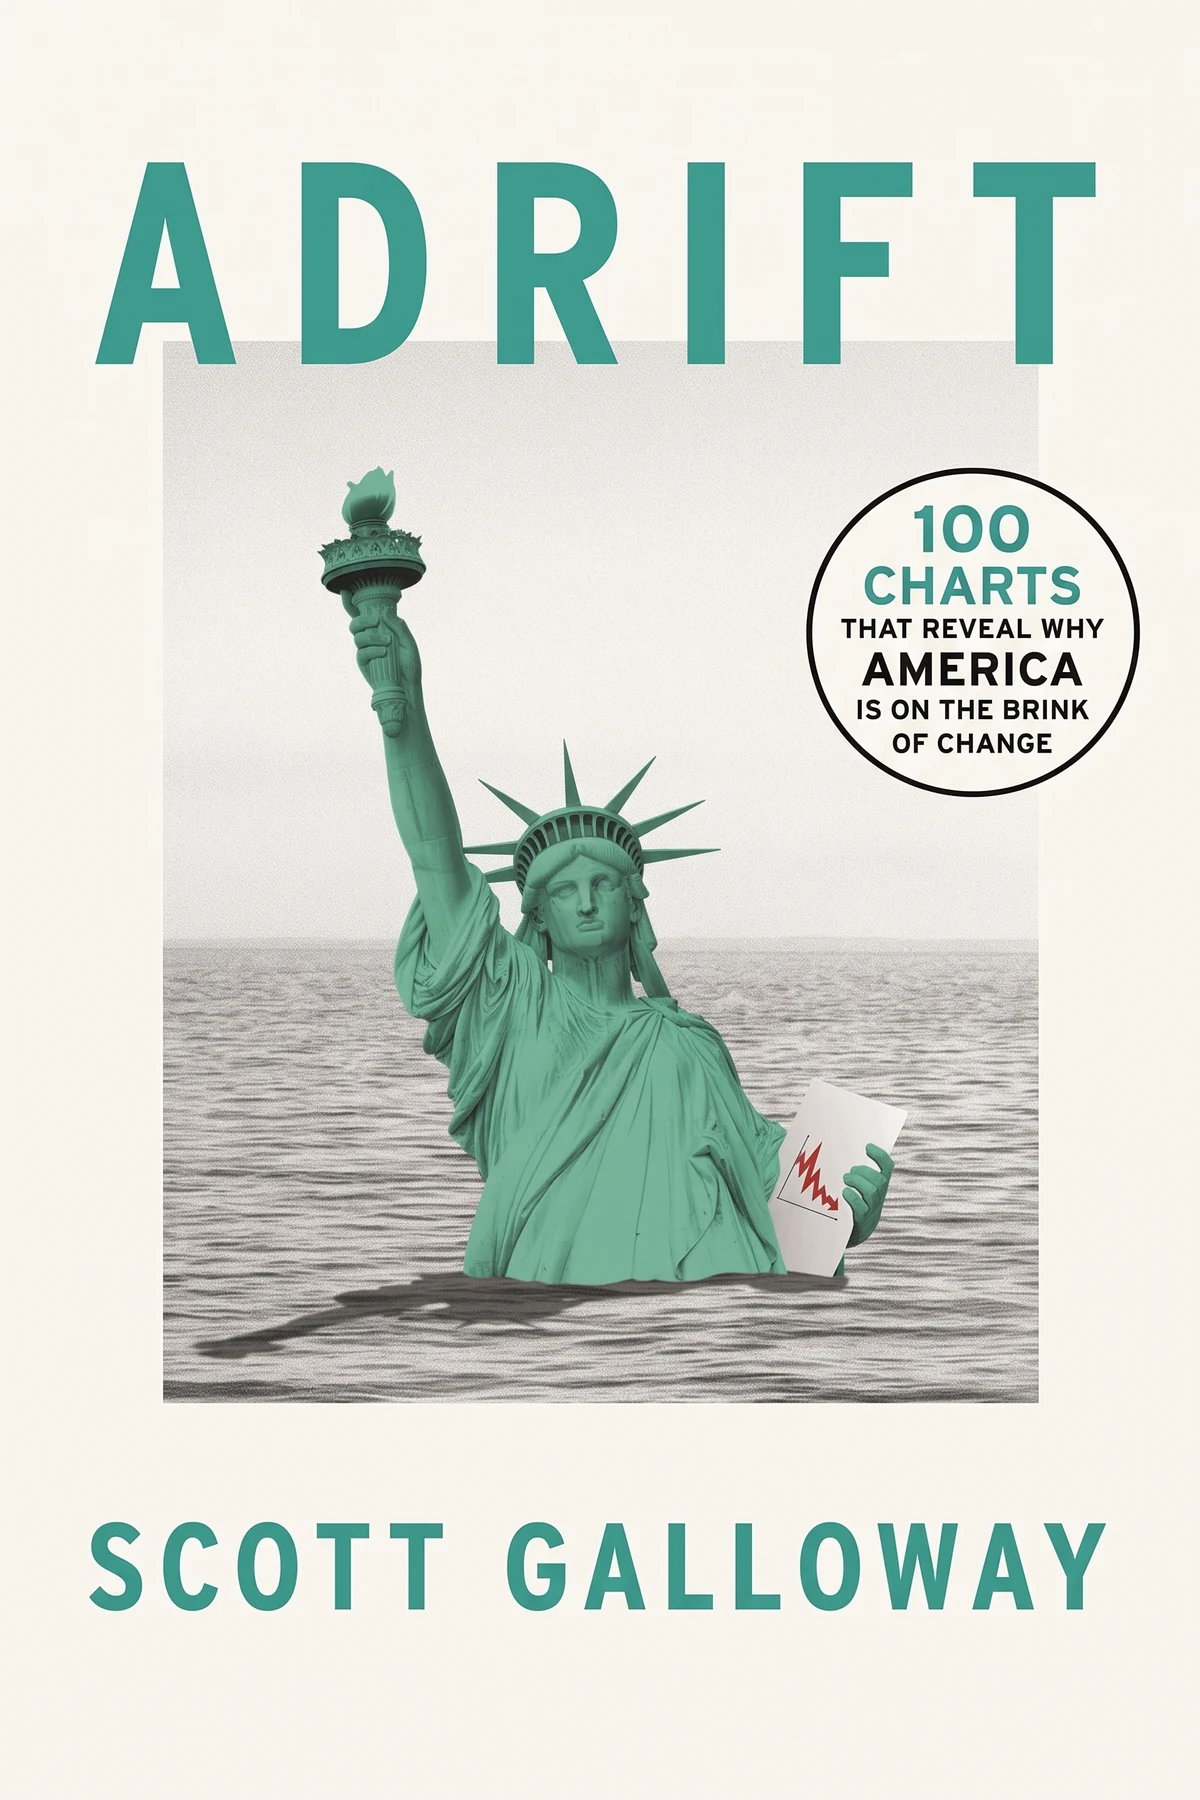
If the news leaves you feeling that everything is fraying and nobody can say why, Scott Galloway offers a map drawn in data. In Adrift, the New York University marketing professor retells America’s story since 1945 through 100 charts, and his opening claim surprises: the country’s greatest postwar invention was neither the computer nor the internet. It was the middle class.
Galloway pictures a nation with plenty of wind, sail and captains that still drifts, lost in partisanship, corruption and selfishness, with no shared direction. His grand economic theory is plain. America moves closest to its ideals when it invests in a strong middle class. Starting around 1980, he argues, it stopped, trading a shared project for a culture of shareholders and individuals. Rising inequality, shrinking friendships, angry feeds and cult-like founders all grow from that turn.
The hope sits inside the diagnosis. People made these choices, so people can unmake them. By the last chapter, a headline about house prices, a soaring stock or a viral outrage will read as part of one pattern, with clear moves, personal and political, that push back.
1 min 49 sec
A record stock market is usually offered as proof the country is thriving. Galloway traces how that single number became the scoreboard, and what got cut once nothing else counted.
1 min 56 sec
Skipped investment never really disappears; somebody pays it back later. Galloway follows the money from poisoned water to executive pay, and finds out who ends up holding the debt.
1 min 50 sec
College prices have exploded while young paychecks barely moved, so skipping school looks smart. The job market tells a different story, and one well-paid route is sitting almost unused.
2 min 00 sec
Each new trillion-dollar company needed less real business to get there than the one before. Galloway asks what filled the gap, and the answer involves charisma, vague slogans and promises nobody kept.
1 min 46 sec
One emotion makes a story spread faster than anxiety or awe, and the platforms know it. Meanwhile the people paid to check facts are disappearing. Galloway shows what that does to your picture of the world.
1 min 52 sec
Social media promised more connection, yet the number of people with a wide circle of friends has collapsed. Galloway’s charts show who is most isolated, and why it matters far beyond loneliness.
1 min 47 sec
Nobody wants a pandemic or a collapsing industry. Yet Galloway finds that upheaval keeps producing new businesses and new chances, and one group of people seems to understand this better than anyone.
1 min 14 sec
Adrift reads like a medical chart for a country, and the diagnosis is hopeful because the illness is self-inflicted. Galloway argues that teen depression, polarized media and inequality driven by a regressive tax system were all made by choices, which means they can be unmade. His prescription is mostly collective: a massive investment in younger Americans, renewed respect for government, which he says tech leaders learned to scorn from a Reagan-era campaign against it, closer ties with allies, and the sense to tell a competitor from an enemy.
Individual habits still count, because citizens who understand the charts are harder for politicians and shady sources to manipulate. Put real time into one group that meets face to face. Treat education or training as a must and hunt for the version you can afford. Judge a company by what it earns and delivers, and check any post that makes you furious before you pass it on.
Galloway invokes a colorized photo of a landing craft at Omaha Beach and imagines those soldiers telling today’s Americans that their problems are fixable. Writing the book left him hopeful, and his line is worth borrowing: nothing is wrong with America that what is right with it cannot fix.
Many people sense that something is breaking: homes are out of reach, friendships are thinning, feeds are furious and a few founders seem to own the future. Scott Galloway argues these are not separate troubles. They are symptoms of one turn in American history. Using 100 charts that run from 1945 to today, Galloway makes the case that the country's greatest postwar creation was its middle class, and that America comes closest to its ideals whenever it invests in one. Starting around 1980, he argues, it chose a different path: shareholder capitalism, deep tax cuts, weaker labor and a growing worship of individual innovators. The bill landed on the young, who now face costlier homes and degrees and worse odds of out-earning their parents. The book is also stubbornly hopeful. Galloway shows how crisis and instability create openings, how global poverty has collapsed, and why problems made by policy can be unmade by it. Readers get a clear frame for the headlines, plus practical choices about education, investing, news and community that push the other way.
Professionals who feel the economy is rigged and want the data behind that feeling.
Young workers weighing college, apprenticeships and housing while worrying they will never out-earn their parents.
Investors and news readers tired of hype who want a sharper filter for founders and feeds.
Scott Galloway, born in 1964, is a professor of marketing at New York University's Stern School of Business, where he teaches brand strategy and digital marketing to second-year MBA students. In 2012, Poets and Quants named him one of the world's top 50 business school professors. He has founded nine firms, including L2, Red Envelope, Prophet and Section4, hosts the Prof G and Pivot podcasts, and writes the weekly No Mercy / No Malice blog. His other books include The Four, Post Corona and The Algebra of Happiness.

Listeners find the work both educational and straightforward, highlighting the high-quality charts and graphics that facilitate informed conversations. The prose is described as brief and engaging, with a presentation that is visually stimulating. Furthermore, they value the insights regarding economic policy, with one listener observing how the book demonstrates the real-world results of political actions. Nevertheless, reactions to the narrative's speed are divided.
Scott Galloway has a way of turning dense economic trends into something you can actually digest while drinking your morning coffee. This book is a visual autopsy. I loved how the 100 charts showed exactly where the middle class started to fracture. While some find the 'doom and gloom' tone overwhelming, it felt like a necessary wake-up call regarding our policy choices since the 1980s. These graphics are well-constructed. They make for an excellent reference during dinner party debates about wealth inequality. I do wish there were more solutions offered earlier in the book, but the clarity of the data makes it worth every penny. It’s a concise, visual history that every voter should flip through before the next election cycle.
Show moreFinally got around to reading this and I’m blown away by how effectively Galloway distills our national identity crisis into a single volume. Data is destiny. The sheer scale of how we've moved from a culture of investment to a culture of entitlement for the 1% is frankly staggering and deeply unsettling. I found the chapter on the loneliness of young men particularly haunting, as it connects economic stagnation to social decay in a way few other authors do. While the book is undeniably 'angry,' it feels like a righteous anger backed by cold, hard numbers. It’s concise, punchy, and provides a clear-eyed look at the consequences of our collective political choices. This should be required reading in every civics class across the country.
Show moreWhat a fascinating, if entirely demoralizing, look at the trajectory of our country over the last several decades. Galloway uses 100 distinct charts to map out our transition from a post-war powerhouse to a fragmented society struggling with historic levels of inequality. The visual representations of CEO compensation versus average worker pay were particularly striking and easy to understand. I appreciate that he doesn't shy away from blunt language or the messy reality of our current political climate. Some critics say it’s too negative, but I think we need this level of honesty to realize just how far off course we’ve drifted. It’s a quick read that packs a massive emotional and intellectual punch, leaving you with much to ponder.
Show morePicked this up after hearing Prof G on a podcast and it’s essentially a high-gloss, bound PowerPoint presentation of his best riffs. The pacing is a bit erratic because you’re jumping from the crisis of lonely young men to the skyrocketing costs of healthcare in just a few pages. However, the visual representations of our national drift are genuinely eye-opening, even if you’re already familiar with the general themes of income inequality. To be fair, some of the charts lack detailed unit labels or specific year-range explanations, which might frustrate the data nerds in the room. Still, it functions as a powerful summary of how specific political decisions led us to this stagnant moment. It’s a fast read that leaves you feeling significantly more informed, if slightly more depressed.
Show moreAs someone who usually avoids dry economic texts, I found this remarkably easy to get through without my eyes glazing over. The '100 charts' format is genius because it breaks down complex geopolitical shifts into bite-sized, visual chunks that tell a cohesive story. You can really see the outcomes of various tax codes and social policies over the last fifty years laid bare. I appreciated the sections on the 'billionaire boy's club' and how tech monopolies are reshaping our society in ways we haven't fully grasped yet. My only gripe is that it feels a bit cherry-picked at times to support a specific narrative, leaving out some of the more positive metrics of human progress. Regardless, it’s a fascinating look at where we are and how we might find our way back.
Show moreTo be fair, I didn't learn a ton of new information, but the way Galloway organizes the data makes it a fantastic reference for future discussions. He has this knack for taking a pile of messy statistics and turning them into eye-catching graphics that highlight the sheer scale of our current challenges. I particularly liked the focus on how we treat our veterans and the aging population compared to other developed nations. It’s a bit of a 'doom-scroll' in book form, which can be exhausting if you read it all in one sitting. However, the message about our failing infrastructure and the need for a stronger middle class is delivered with incredible clarity. It’s a sharp, visually appealing autopsy of the 21st-century American economy that hits hard.
Show moreAfter hearing so many polarized opinions about Scott Galloway, I wanted to see the data for myself. This book is a very concise guide to the current state of America, stripping away the rhetoric and focusing on what the numbers actually say about our health, wealth, and education. I liked that it wasn't just a dry list of facts but a narrative about how political choices have tangible outcomes for everyday people. The graphics are well-constructed, making the information accessible even to those who aren't usually 'math people.' While there is a definite slant to the interpretation, the underlying data points are hard to argue with. It’s an interesting, visually-driven read that successfully captures the anxiety of the current moment without being entirely hopeless.
Show moreDoes America really need another book telling us that the middle class is shrinking and college is too expensive? Galloway is a brilliant marketer, and it shows here; the book is a sleek, visually stunning product that somehow says very little that hasn't been said before. If you’ve been paying any attention to the news for the last decade, many of these 'revelations' will feel like common sense. The charts are pretty, but they often lack the deep-dive analysis I was hoping for, frequently offering just a paragraph of context. It's essentially a coffee table book for people who want to look smart while complaining about the economy. It’s not a bad resource for a younger reader, but for anyone well-versed in current events, it’s a lot of style over substance.
Show moreEver wonder why everything feels so broken lately? Galloway’s book tries to answer that with a series of graphs that are sometimes brilliant and sometimes just pointing out the obvious. The pacing is a bit hit-or-miss; some sections are deeply researched while others feel like filler to get to that magic '100 charts' number. I found myself wishing for a more in-depth look at the solutions, which are tucked away at the very end like a brief PR addendum. It’s a visually appealing book, no doubt, and it makes for a great conversation starter on your bookshelf. But if you’re looking for a rigorous economic thesis with flawless data labeling, you might want to look elsewhere. It’s more of a high-level summary than a deep dive.
Show moreThe title is a bit of a misnomer. Galloway claims we are 'adrift,' but he clearly has a very specific, biased destination in mind for the reader. Frankly, I was disappointed by the technical quality of the graphics throughout the entire volume. Some axes aren't labeled at all. Units are missing. The data seems transformed without any explanation of the methodology. It’s disrespectful to the reader’s time when a book built entirely around charts fails at basic data visualization standards. Furthermore, the author spends way too much time on his personal anecdotes and pro-immigration stance rather than letting the numbers speak for themselves. I expected non-obvious insights but got a partisan PowerPoint presentation instead. Avoid if you want real data.
Show moreGalloway argues that America does best when it invests in a strong middle class, which he calls its greatest postwar invention. Around 1980 the country turned toward shareholder capitalism, tax cuts and individualism. Using 100 charts, he links that shift to rising inequality, costlier homes and degrees, founder worship, outrage-driven media and fading friendships. Because these problems were created by choices, he insists they can be reversed.
It is the idea that a company should be judged by one number, its share price. Galloway names Milton Friedman as its leading voice and Ronald Reagan’s tax cuts as its policy engine. Under it, the top tax rate fell from 70 to 28 percent, strikes became rare, and by 2016 more than half of US corporate profits were booked in foreign tax havens.
Yes, though Galloway admits it has become brutally expensive, with costs up 169 percent between 1980 and 2019 while young workers’ earnings rose 19 percent. Jobs open to people with only a high school diploma fell from 72 percent in 1973 to 36 percent in 2020. He also urges a closer look at apprenticeships, since 94 percent of completers start on an average of $70,000 or more.
Not in the end. Galloway lays out serious problems, but he also stresses that extreme poverty fell from over 40 percent of humanity to under 10 percent since 1980, and that crises spark new businesses. He says writing the book left him hopeful, because the country has overcome far bigger challenges and today’s problems are mainly a matter of will.
bell hooks

Yanis Varoufakis

Fay Bound Alberti
Daniel Goleman
Andrew Ross Sorkin
AUDIO SUMMARY AVAILABLE
Get the key ideas from Adrift by Scott Galloway, plus 5,000+ more nonfiction titles.