15 min 07 sec
Available in: English
The Misbehavior of Markets: A Fractal View of Financial Turbulence
Shows why standard finance models underestimate market risk, and how Mandelbrot's fractal geometry, built for jumps, trends and patterns that repeat at every scale, gives a truer picture of how prices move.
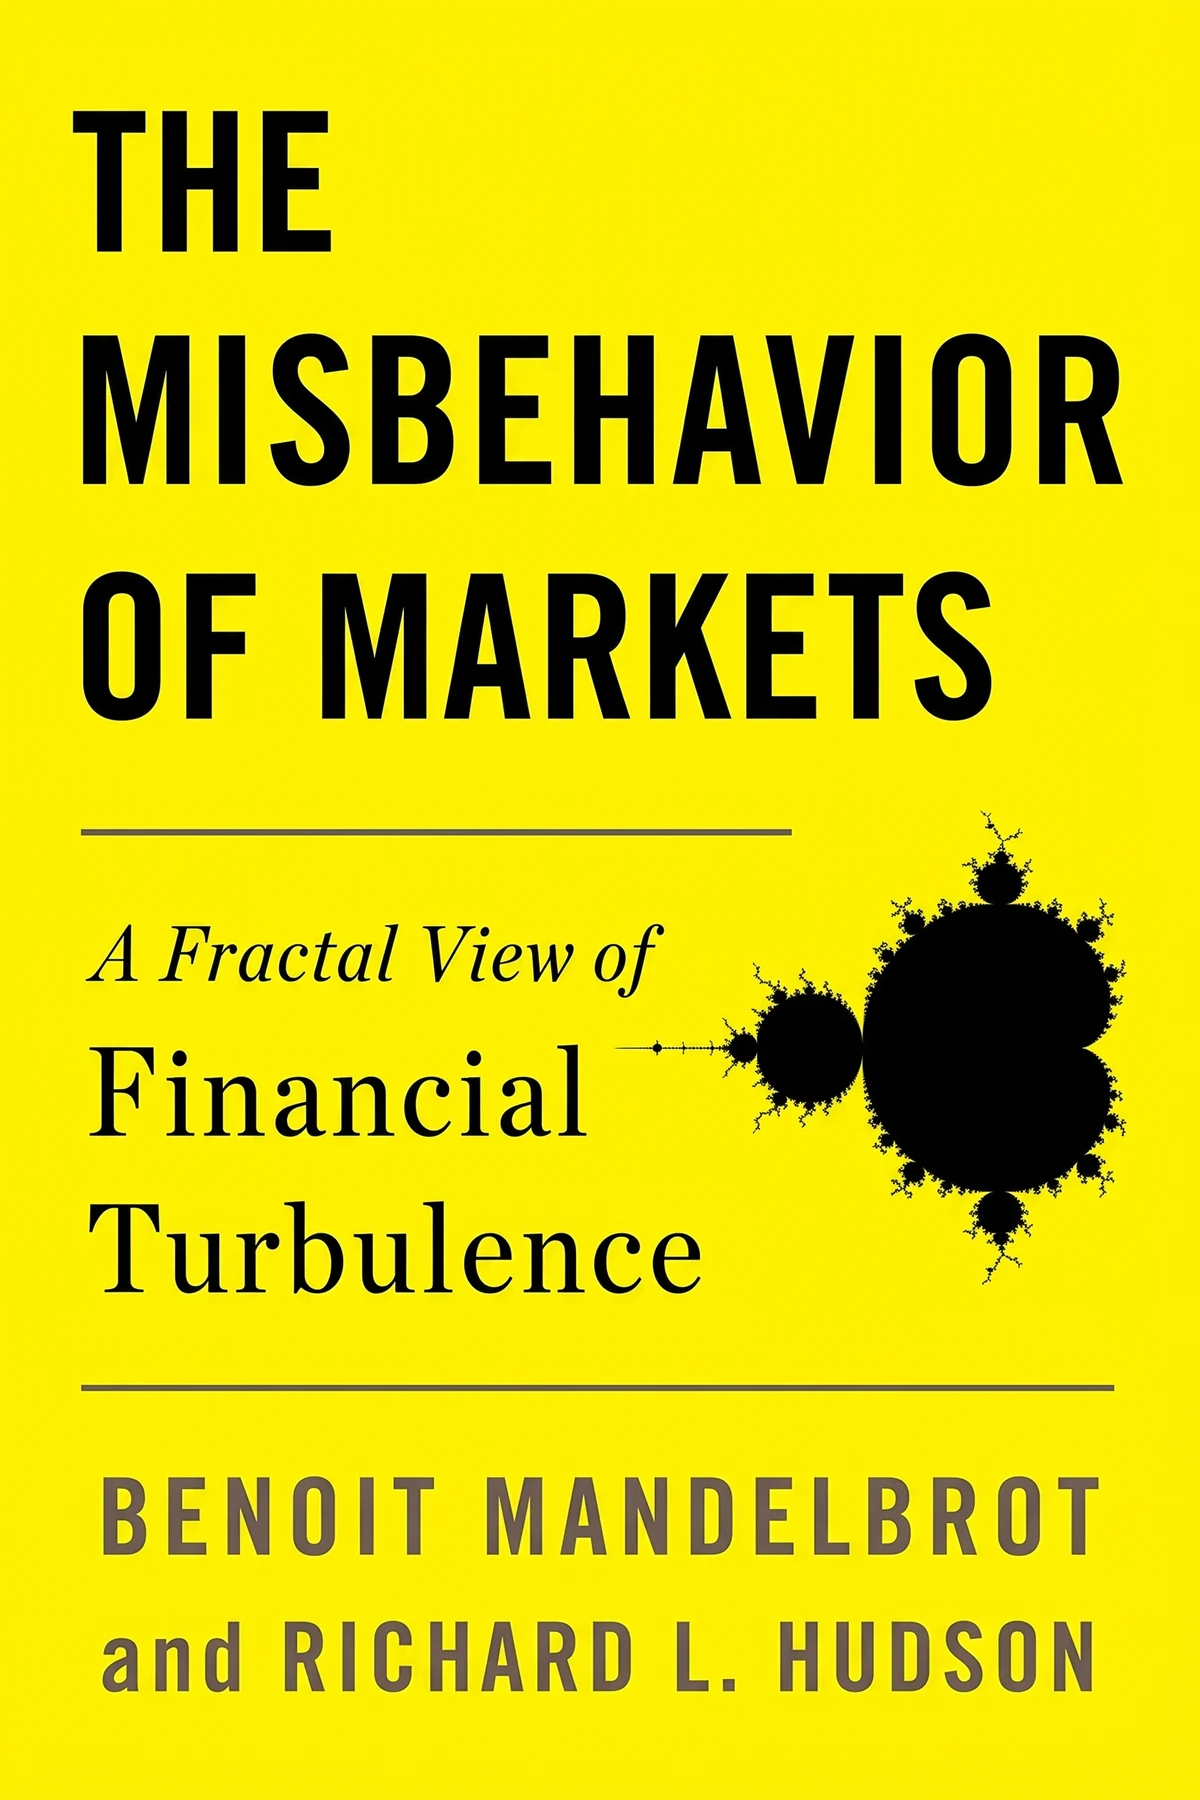
Table of Content
1. Introduction
1 min 01 sec
If you hold investments, the standard models treat a market crash as so rare it can be ignored, and then one arrives anyway, as it did in 2008. In The Misbehavior of Markets, Benoit Mandelbrot, the mathematician who invented fractal geometry, and former Wall Street Journal editor Richard L. Hudson blame the models.
Mainstream finance imagines investors as identical, perfectly rational machines and prices as smooth and well behaved. Real markets are rough. Prices leap, trends feed on themselves, and quiet weeks give way to days when everything moves at once. The authors argue that this roughness has its own order, the kind found in turbulent wind and in a head of Romanesco broccoli, and that tools built for roughness reveal risks the smooth models miss.
Expect a clearer sense of how large market risk really is, and a few sharp questions to put to any forecast before you trust it with your money.
2. Stop assuming investors behave like machines
1 min 49 sec
A simple coin-flip game shows that people choose differently when the same odds are framed as a gain or a loss. Most of finance is built as if that never happens, and your savings feel the difference.
3. Know your own time horizon before taking advice
1 min 51 sec
A day trader and a pension saver can look at the same stock on the same morning and both act sensibly in opposite ways. Standard theory insists they are the same person.
4. Prepare your money for sudden price jumps
1 min 54 sec
Men’s heights cluster neatly around an average, and standard finance assumes prices do the same. A rounding habit and a drug approval show why that comfortable assumption can cost you dearly.
5. Spot the memory hiding in price trends
1 min 52 sec
A 1900 doctoral thesis on Paris speculators became the base of modern finance. It claimed past prices tell you nothing. Later research found that markets remember, in two very different ways.
6. Find the order inside market chaos
2 min 08 sec
A vegetable built from smaller copies of itself turns out to explain why a century of cotton prices defeated a Harvard professor. The same shape hides inside every wild week on the market.
7. Measure market time by what happens in it
1 min 44 sec
One frantic trading day can hold as much as six calm ones, yet charts give each the same width. Redrawing the calendar around events makes hidden patterns in prices visible again.
8. Learn from two firms that bet on roughness
1 min 44 sec
In a year when the whole market lost a third of its value, one fund using fractal methods posted strong gains. Another firm saw its capital more than double. What did they do differently?
9. Conclusion
1 min 04 sec
The Misbehavior of Markets asks you to give up a comforting picture for a truer one. In the comforting picture, calm and identical investors make rational choices, and prices drift along a bell curve one independent step at a time. In the truer one, people gamble to dodge a loss, day traders and pension savers run on different clocks, prices leap on news, trends carry memory, and turbulence repeats from a week to a decade like the florets of a Romanesco broccoli. Mandelbrot and Hudson’s charge is that the old models vastly underestimate risk, and that crises like 2008 are what believing them costs.
The rough view changes what you watch for. Assume a single day can move far more than any bell curve permits, and keep your bets small enough to survive it. Grow wary when a long rise starts to feel like safety. Judge a stretch of market history by how much happened in it.
Turbulence is not a mistake in the market’s data. It is the data.
About this book
What is this book about?
Mainstream finance offers neat, precise models of how markets behave. Yet markets keep collapsing in ways those models fail to see coming, as the 2008 crisis showed. Benoit Mandelbrot, the mathematician who invented fractal geometry, and journalist Richard L. Hudson argue that the trouble starts with the models' assumptions, not with the markets. The orthodox picture treats every investor as a perfectly rational machine with the same goal and the same time horizon. It assumes prices glide along a bell curve, each move independent of the last. The authors take these ideas apart one by one, using a coin-flip experiment on how people judge gains and losses, Campbell Harvey's research on price trends, and a century of cotton prices that would not fit the standard model. In their place they offer a fractal view, in which roughness is the rule and the same patterns repeat whether you look at a week or a decade. Readers get plain-language tools such as trading time, which measures markets by how much happens rather than by the clock, and two cases of firms that used fractal methods and did well. The book is written for readers who are not mathematicians.
Book Information
Who it's for
Individual investors
Individual investors who suspect the textbook view of risk is too calm.
Finance students and analysts
Finance students and analysts who want a readable challenge to bell curves and random walks.
Risk professionals
Professionals who report on or manage risk and want a plain-language guide to fractal thinking.
About the Author
Benoit Mandelbrot
Benoit Mandelbrot (1924 to 2010) invented fractal geometry. Born in Warsaw, he studied mathematics in Paris and the United States, spent 35 years at IBM, where early computer graphics led him to the Mandelbrot set, and later became Sterling Professor of Mathematical Sciences at Yale. His honors include the 2003 Japan Prize. Richard L. Hudson was an editor at the Wall Street Journal and publisher of its European edition. The book grew from their many conversations.
Ratings & Reviews
Ratings at a glance
What people think
Listeners find the book provides immense insight and is very easy to follow, with one listener noting it functions as a valuable introduction to fractal thinking. Furthermore, the quality of the writing is exceptional, and listeners consider it highly applicable, with one review highlighting its novel mathematical approach to securities prices. Additionally, the book offers a grounded look at finance and investing, with one listener describing it as an extraordinary perspective on financial markets. However, listeners have divided views on the market performance aspect, and its effectiveness receives mixed feedback.
Top reviews
Henry
After hearing about Mandelbrot’s work in nature documentaries, I finally picked this up to see how he translates fractals to the world of finance. It’s an extraordinary perspective that really challenges everything you think you know about securities prices. Mandelbrot argues that the standard financial models—the ones used by major banks—are based on a fundamental misunderstanding of risk. Instead of the gentle bell curve we’re taught in school, we’re actually dealing with 'wild' randomness. The way he breaks down how price changes are not independent of each other is genuinely eye-opening. While the book starts with quite a bit of groundwork, it builds a compelling case that the math of nature applies to the chaos of the trading floor. It’s a high-level view that avoids getting bogged down in dense equations, making it accessible even for those of us who aren't math whizzes.
Show moreHannah
Ever wonder why 'once-in-a-century' crashes happen every decade? This book explains that exact phenomenon with profound clarity. Mandelbrot takes down the Efficient Market Hypothesis with surgical precision, showing that the assumptions underlying Modern Portfolio Theory are not just wrong—they’re dangerous. He introduces the idea of 'wild randomness' and explains how markets have a memory, meaning yesterday's price movements do affect today's. The writing quality is top-notch; Hudson clearly helped polish Mandelbrot's complex ideas into something very easy to read. I loved the discussion on how many financial parameters, like the beta factor, are essentially useless because they don't account for the 'fat tails' of the distribution. This should be mandatory reading for anyone working on Wall Street or managing their own investments.
Show moreNarumon
This book provides a much-needed bridge between the abstract beauty of fractal geometry and the messy reality of cotton prices and stock tickers. Mandelbrot’s writing is excellent, and he manages to explain 'multifractality' in a way that doesn't require a PhD. I was fascinated by the biography sections, especially how his family history and his time at IBM shaped his worldview. The book is highly relevant today because it exposes the flaws in the Black-Scholes method and other tools that led to the near-collapse of the global financial system. It’s rare to find a science book by the scientist themselves that is this lucid and engaging. It completely changed the way I look at risk and volatility. Truly an extraordinary perspective on a field that is usually quite boring and abstruse.
Show moreNutnicha
Wow, talk about a paradigm shift. I’ve read my fair share of finance books, but this is the first one that actually made the chaos of the markets make sense to me. The idea that markets are fractal—meaning they are self-similar and follow recursive patterns—is such a powerful concept. It makes you realize how flimsy the 'bell curve' assumptions of Wall Street really are. The book is very easy to read and serves as an excellent introduction to fractal thinking for the uninitiated. It’s more of a philosophical and mathematical critique than a trading guide, but the insights into the 'misbehavior' of prices are absolutely essential. I particularly liked the discussion on how the market is not a 'random walk' but something much wilder. Highly recommended for anyone who hates standard academic economics!
Show moreJames
The chapter on the 10 Heresies of Finance is worth the price of admission alone. If you're planning to dive into this, I actually suggest starting with Part III to get your bearings before tackling the more biographical early sections. Mandelbrot and Hudson do a great job explaining why standard theory fails to account for Black Monday or the 1987 crash. The truth is, the market doesn't follow a Gaussian distribution, and the authors prove it using fractal concepts. My only gripe is that it feels a bit repetitive in the middle sections, and I wanted a bit more 'how-to' for actual investing. It’s more of a critique than a manual. Still, the insight into how price fluctuations appear the same regardless of time scale (hours vs years) is a fascinating concept that has changed my view on volatility.
Show moreSiriporn
Frankly, I was worried this would be a dense math textbook, but it’s surprisingly light on the heavy calculations. It’s more about the 'fractal thinking' mindset than it is about solving equations. The book provides a realistic view of finance that you just don't get from standard textbooks. I found the section on how markets are 'discontinuous' to be particularly relevant in today’s high-frequency trading environment. My only minor criticism is that Mandelbrot spends quite a bit of time mocking 'chartists' while simultaneously calling for a search for patterns, which felt a bit contradictory. However, the core message—that we are vastly underestimating risk—is delivered with such conviction that it’s hard to ignore. It’s a valuable introduction to a new mathematical approach that everyone should at least be aware of.
Show moreZanya
As someone who spent years studying the Efficient Market Hypothesis in grad school, reading this felt like a bucket of cold water to the face. It is a brilliant takedown of the academic dogma that treats price moves like flips of a coin. Mandelbrot shows that price changes follow a power-law distribution, which means the 'impossible' swings we see are actually a natural part of the system. The book is very accessible, which is a feat given the complexity of fractal geometry. I particularly enjoyed the insights into how the French mathematical establishment’s disdain for applied research drove him to explore these topics in the U.S. It’s a bit light on the math for my taste—I wanted to see the actual formulas—but for a general audience, it hits the perfect balance of theory and history.
Show moreTee
Finally got around to finishing this, and while I’m not sure I can use it to pick tomorrow’s winners, it has fundamentally changed how I view risk. The book is a premodern take on time series data that still feels incredibly fresh. I found the concept of 'time compression' in markets to be one of the most interesting parts—the idea that the same patterns repeat regardless of the time scale. It’s a great glimpse into the future of finance, even if that future hasn't quite arrived yet. To be fair, some of the layman explanations are a bit hand-wavy, and there are parts where I felt like Mandelbrot was holding back on the technical details to keep the book 'popular.' But overall, it’s a very interesting mix of theory and history that I'd recommend to any serious investor.
Show moreNiphon
To be fair, Mandelbrot is clearly a genius, but his tone can be incredibly strident and self-congratulatory at times. There is a lot of 'I told you so' regarding his early research in cotton markets and his time in France. While I appreciate the biography of his move to the U.S., it occasionally felt like the book was more about his personal vindication than the actual mechanics of the market. The layman explanations for fractals were lucid, but when it came to applying them to specific trading strategies, the book became a bit vague. It’s a decent read for the history of economic thought, but if you’re looking for a direct guide on how to improve your portfolio performance, you might leave feeling a little frustrated. It’s a strong critique of the status quo, but it doesn't offer a complete replacement for it.
Show moreJun
Not what I expected from a book about markets, and it felt a bit like a collection of 'what if' stories rather than a rigorous study. The author seems far too in love with his own theory of fractals and tries to force it onto the stock market even where it doesn't quite fit. While the history of his life was somewhat interesting, the book as a whole felt very repetitive. He spends hundreds of pages telling you why everyone else is wrong, but he never actually provides a functional model that a regular person could use to gauge risk or improve their returns. It’s fine as a philosophical exercise or a critique of academia, but for a book with 'Markets' in the title, it was light on actual market mechanics. I found it quite dry and ultimately more about the author's ego than anything else.
Show moreQuestions about this book
What is the main idea of The Misbehavior of Markets?
Mandelbrot and Hudson argue that mainstream finance rests on false assumptions: rational, identical investors and prices that glide along a bell curve, each move independent of the last. Real markets are rough, with sudden jumps, trends and turbulence. Fractal geometry, which finds repeating patterns in rough things, describes this behavior better, and the authors say the old models vastly underestimate market risk.
What does fractal geometry have to do with stock prices?
Fractals are shapes whose pattern repeats in smaller and smaller copies, like Romanesco broccoli. The authors show that markets share this self-similarity. When Harvard professor Houthakker studied a century of cotton prices, they would not fit the standard model, yet charts of the same data over a week and over a decade look roughly alike. Power laws capture this scale invariance.
What is trading time in The Misbehavior of Markets?
Trading time measures market intervals by the amount of information, such as a set number of price movements, and ignores the clock. Because a turbulent day can hold as much activity as six quiet ones, intervals stretch or shrink with events. The authors argue this distorted time helps reveal patterns that calendar-based analysis hides.
Does anyone actually use fractal analysis in finance?
Yes, according to the book. Currency provider Oanda analyzes all its real-time price data with fractal geometry, and its net capital more than doubled in 2003. Capital Fund Management, the biggest hedge fund company in France, relies on multifractal analysis to control risk and price options; in 2002, while the market dropped by a third, its biggest fund rose 28.1 percent.
How can I apply The Misbehavior of Markets as an investor?
The book points to a few lessons. Expect prices to jump rather than glide, because the book argues that smooth bell-curve models badly understate real market risk. Remember Campbell Harvey’s finding that stocks rising for five years become more likely to fall over the next five. And judge risk by how much happened in a period, not just how long it lasted.
Readers also enjoyed

Adults in The Room: My Battle With Europe’s Deep Establishment
Yanis Varoufakis
1929: Inside the Greatest Crash in Wall Street History--and How It
Andrew Ross Sorkin
23 Things They Don’t Tell You About Capitalism
Ha-Joon Chang
A Little History of Economics
Niall Kishtainy

A Splendid Exchange: How Trade Shaped the World
William J. Bernstein
AUDIO SUMMARY AVAILABLE
Listen to The Misbehavior of Markets in 15 minutes
Get the key ideas from The Misbehavior of Markets by Benoit Mandelbrot, plus 5,000+ more nonfiction titles.
- 5,000+ titles
- Listen as much as you want
- 7-day free trial
- Cancel anytime