14 min 59 sec
Available in: English
The Data Detective: Ten Easy Rules to Make Sense of Statistics
By Tim Harford
A practical guide to reading numbers without being fooled or turning cynical. It covers what to ask about any statistic, chart, study or algorithm before you believe it, act on it or pass it on.
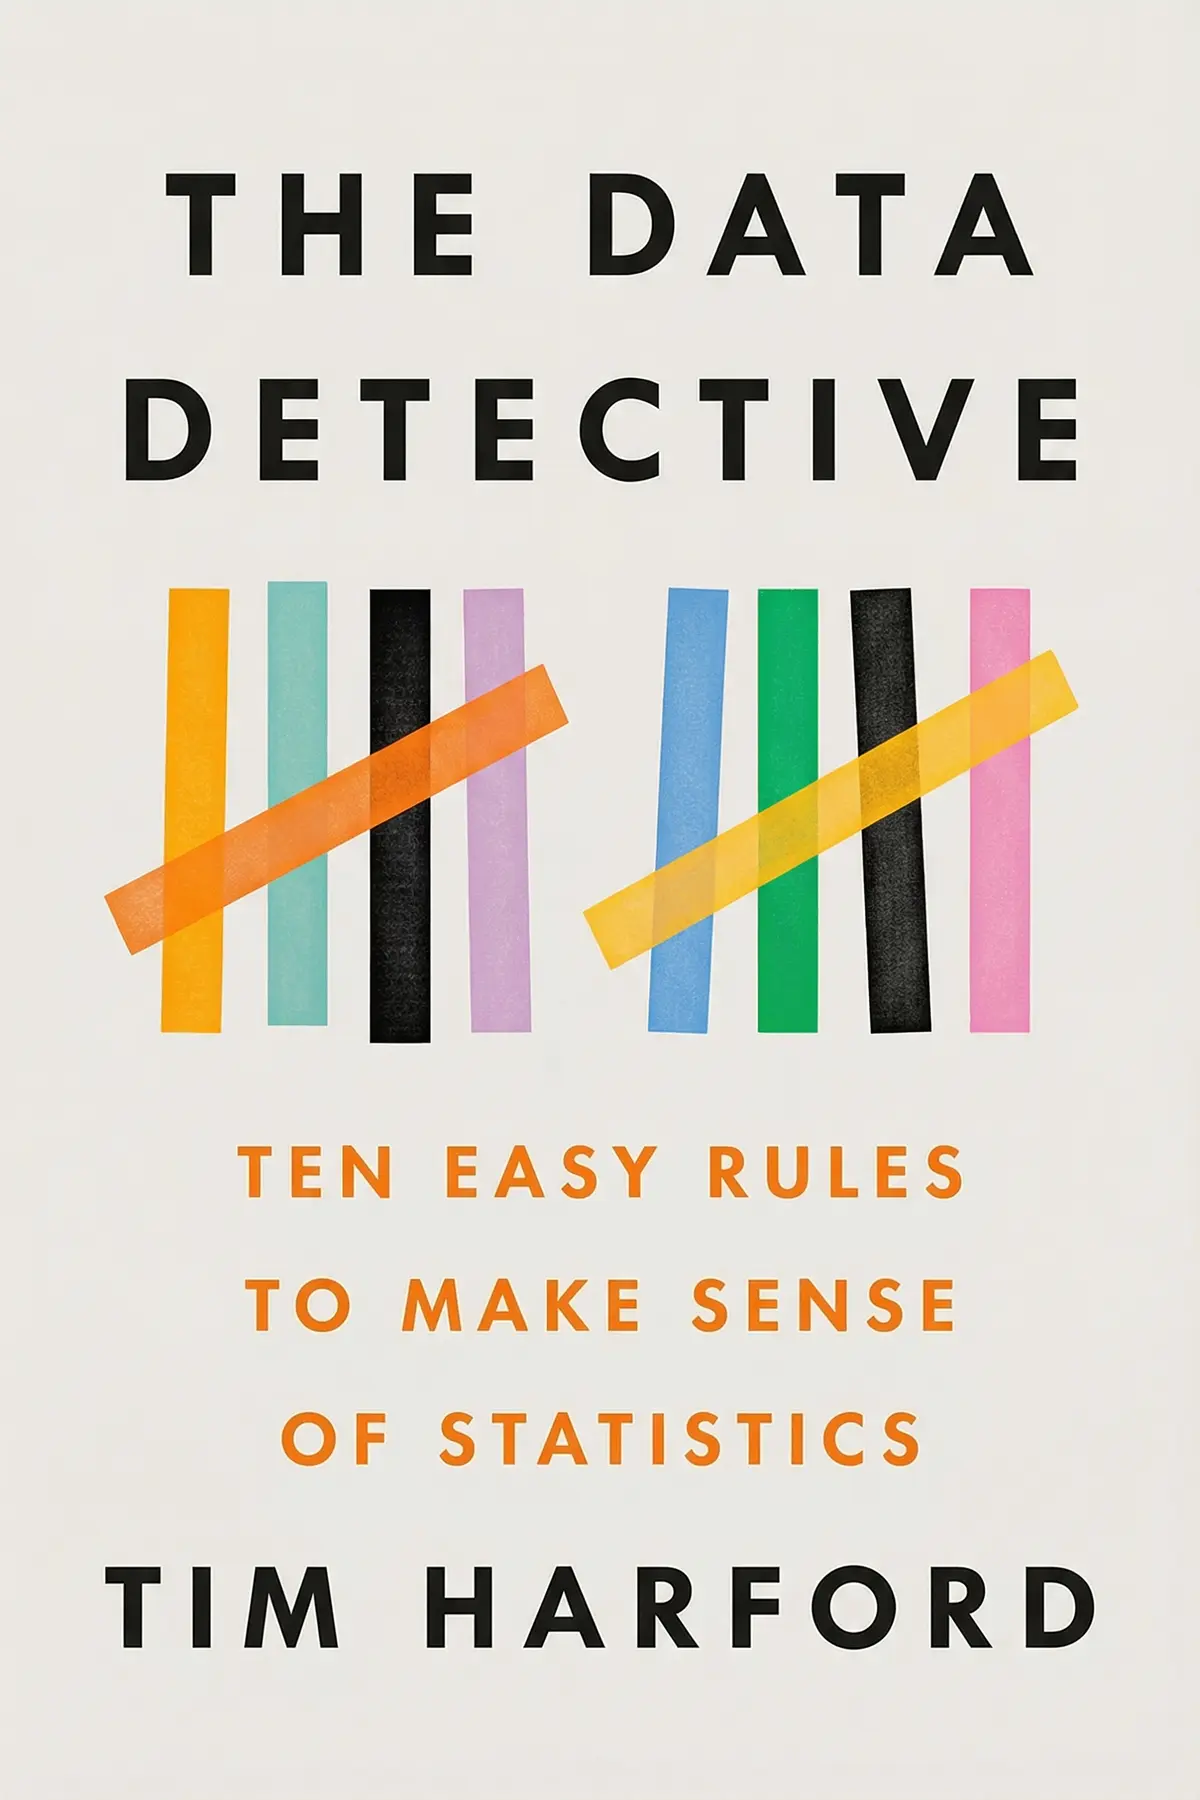
Table of Content
1. Introduction
58 sec
Countries with more storks also tend to have more babies, a pattern anyone could twist into proof that storks deliver infants. In The Data Detective, Financial Times columnist Tim Harford, presenter of the BBC radio program More or Less, uses tricks like this to make an unexpected case. Giving up on statistics is no defense, because the same tools revealed that smoking makes lung cancer 16 times more likely.
If you tend either to swallow every figure or to distrust them all, Harford offers a middle path. Numbers earn your trust once you have checked your own feelings, asked what was counted and against what, looked for who is missing, and stayed ready to change your mind. A forged Vermeer, half-empty London buses, a jam stall and a flu tracker fooled by basketball all make the case. The reward is a handful of questions to put to any number before you repeat it.
2. Check your feelings before you check the numbers
1 min 30 sec
One of the world’s leading art experts inspected a newly discovered masterpiece for every sign of forgery and found nothing wrong. The flaw he missed was not on the canvas, and most of us share it.
3. Know when your experience beats the official figure
1 min 40 sec
Official data said London’s buses and trains were close to empty. Harford’s daily commute said the opposite. Working out which one was lying leads to a simple test for when to trust numbers and when to trust people.
4. Ask what was counted before you take sides
1 min 39 sec
Britain seemed to face a deadly gap in newborn survival between regions, and nobody could explain it. The real cause had nothing to do with medicine, and it hides inside many numbers we argue about.
5. Give every alarming number a wider frame
1 min 30 sec
In 2018, London headlines announced the city had become deadlier than New York. The figures were accurate. Stepping back a few decades turns the story upside down, and a short list of memorized numbers does the same trick.
6. Look for the studies and people left out
1 min 42 sec
A famous jam-tasting experiment became a pop-psychology sensation for suggesting that too much choice puts buyers off. Yet the full body of research tells a stranger story, and so do the students who took part in a classic test of conformity.
7. Trust numbers that are open and independent
1 min 43 sec
Google once claimed it could track flu outbreaks faster than public health officials, using nothing but searches. A sober US budget office and a hidden pile of Greek debt show which kinds of numbers actually deserve your faith.
8. Read the axes before you admire the chart
1 min 31 sec
A colorful animation about money looked brilliant and was badly wrong. A diagram drawn by a nurse in the 1850s looked just as striking and changed the law. What separates the two is something any viewer can check.
9. Change your mind and forecast better
1 min 35 sec
A psychologist collected tens of thousands of expert predictions and waited eighteen years to score them. The results were humbling, but a second study found a small group who kept getting it right, and one trait set them apart.
10. Conclusion
1 min 11 sec
Harford’s rules add up to one temperament: curiosity that does not stop at the first answer. Bredius knew more about Vermeer than almost anyone, and desire still outran expertise. Google had oceans of data and no idea what linked it to flu. Tetlock’s experts were clever and stubborn, and stubbornness won. In each case the numbers were not the weak point. The reader was, and readers can be trained.
Start with one statistic this week that makes you angry or pleased. Name the feeling. Ask what was counted, over what period, and next to what. Ask who was left out of the sample, and whether anyone gains from the figure looking the way it does. Keep a few landmark numbers in mind so millions and billions stop blurring together. Then, if the answer surprises you, let it move you.
Statistics, read honestly, showed that cigarettes cause cancer and that COVID-19 spreads from person to person. Storks, meanwhile, still do not deliver babies. Telling those two kinds of claim apart is the detective’s skill, and Harford makes the case that anyone can learn it.
About this book
What is this book about?
Numbers reach us all day through headlines, charts, studies and dashboards, and many people end up either believing all of them or trusting none. Tim Harford argues that both reactions are mistakes. Statistics can be bent easily, but they are also how we learned that smoking raises lung cancer risk sixteenfold and that COVID-19 spreads between people. Harford's approach is detective work. He starts with the reader's own emotions, which fooled a world expert into praising a forged Vermeer. From there he moves to the questions that expose a misleading figure: what exactly was counted, compared with what, over what period, and who was left out of the sample. His examples include London's half-empty buses, a scary murder headline, a famous jam-tasting study, Google's failed flu tracker, Greece's hidden debts and Florence Nightingale's rose diagram. The book ends with Philip Tetlock's research on forecasters, which found that the best predictors share one trait: they change their minds when evidence changes. Readers get a short set of habits for judging any number calmly and clearly.
Book Information
Who it's for
Professionals who read reports
Professionals who read dashboards, reports and studies and want to know which numbers deserve their trust.
Managers measuring performance
Managers who judge performance with data and want to avoid figures people have learned to bend.
Curious news followers
Curious news readers tired of choosing between believing every headline and doubting them all.
About the Author
Tim Harford
Tim Harford is a senior columnist at the Financial Times, where his long-running column The Undercover Economist explains the economics behind everyday life. Since October 2007 he has been the presenter of More or Less on BBC Radio 4, and he hosts Cautionary Tales, a podcast. He is an honorary fellow of the Royal Statistical Society and an associate member of Nuffield College, Oxford, and in 2019 he was made an OBE for services to improving economic understanding.
The Undercover Economist
Tim Harford
Ratings & Reviews
Ratings at a glance
What people think
Listeners find the writing to be superb and captivating, with one listener observing how storytelling is used to convey actionable principles. They also value its clear and accessible nature, as one listener points out the helpful guidelines provided for better understanding statistics. The book's high readability is another highlight, with one listener remarking that it makes learning about statistics surprisingly fun. Nevertheless, the political leanings spark varied opinions, with one listener noting that the content gets very political right out of the gate.
Top reviews
Den
Tim Harford has a knack for making numbers feel human, and this book is a masterclass in that approach. Instead of dry formulas or tedious p-value calculations, he uses gripping stories to illustrate how we often let our emotions cloud our judgment. I especially loved the section on the "hot sauce paradigm" and the way we define things like "violent video games." It shows that the words we use to describe data are just as important as the numbers themselves. Frankly, it is refreshing to read a book about statistics that actually focuses on the psychology of the person reading the chart. Harford encourages us to be data detectives by staying curious rather than being cynical. If you enjoyed Hans Rosling’s work, you will find this to be a wonderful companion piece. It's accessible, funny, and deeply practical for anyone living in the modern world.
Show moreDuang
Ever wonder why we are so easily fooled by a well-placed chart? Harford explains that our desire to be right often overrides our ability to be accurate. He uses fantastic examples, like the story of the "sheep in the field" that turns out to be a lamb and a pregnant ewe, to show how counting is harder than it looks. This book isn't about math; it's about the stories we tell ourselves. The writing is incredibly fluent and the humor is top-notch for a book on this subject. I found myself laughing at the "premature enumeration" jokes while simultaneously rethinking how I consume the morning news. It’s rare to find a book that is this engaging while also teaching you how to think more clearly. It makes being a data detective feel like a superpower that anyone can learn.
Show moreRay
Finally got around to reading this, and it’s essentially the spiritual successor to Hans Rosling’s 'Factfulness'. Harford’s "Golden Rule" of curiosity is such a simple but powerful idea. If we approach data with wonder instead of a desire to win an argument, the world looks very different. The book is packed with great examples, from the Hillsborough stadium inquest to the way inflation stats can be manipulated by governments. Each chapter is short and punchy, making it easy to digest one rule at a time. The way he frames statistical heroes like Florence Nightingale really changes your perspective on what data can actually do. It isn't just about numbers; it's about seeing the world clearly. It makes the "magic" of reason feel accessible to everyone. I absolutely loved it and will be recommending it to my colleagues.
Show moreLeah
This book should be mandatory reading in every high school. It’s not a math textbook; it’s a survival guide for the information age. Harford teaches you how to look for the "backstory" of a number—who was included, who was left out, and why the data was collected in the first place. The distinction between decoration and information in charts was particularly eye-opening for me. I love how he uses humor and relatable scenarios, like his wife asking him about statistics over breakfast, to make the concepts feel real. It’s a very encouraging book that makes you feel empowered rather than overwhelmed by the sheer amount of data out there. You'll walk away from it with a much better sense of how to be a detective in your own life. Truly excellent and highly recommended.
Show moreLandon
The chapter on Florence Nightingale was a revelation to me. We’re taught she was just the "Lady with the Lamp," but Harford correctly highlights that she was a brilliant statistician who used data visualization to force actual government policy changes. That kind of storytelling makes the principles stick. The book provides a solid toolkit for questioning the graphs and soundbites we see every day. I appreciated the distinction between the "worm’s-eye view" and the "bird’s-eye view"—it’s a great way to think about how reality is recorded. My only gripe is that it gets a bit preachy in the early chapters regarding climate change, which felt like it contradicted his own rules about keeping an open mind. Still, for anyone who wants to stop being bamboozled by pundits, this is a very readable and helpful guide.
Show moreWatcharaporn
After hearing Harford on the radio, I had high hopes for this toolkit, and for the most part, it delivered. The 10 rules are excellent guardrails for your brain. He does a great job explaining why we should be skeptical of grand claims without becoming cynical about all data. The way he breaks down how definitions matter—like what counts as a "gun death" or "binge drinking"—is essential reading. It’s very readable and doesn't get bogged down in technical jargon like p-values or medians. I did feel like some of the examples, like the Doll and Hill lung cancer study, didn't quite connect back to the idea of the average citizen scrutinizing data. Most people will never read the original research anyway. Regardless, it’s a thoughtful and useful overview of how to maintain a healthy attitude toward the statistics we see online.
Show morePensuda
As someone who struggles with math, I found this surprisingly accessible and fun. Harford is an economist who writes like a storyteller. He doesn't make you feel dumb for not understanding a spreadsheet; instead, he shows you that the spreadsheet might be hiding something important. The book is really about critical thinking and checking your own biases. I liked the focus on data visualization and how often it's used as mere decoration or even disinformation. It’s given me a lot of "trust issues" with scientific studies I used to take at face value, like the famous jam study. That’s probably a good thing, though! The book is a quick read, very empathetic, and full of interesting history. I’d recommend it to anyone who wants to feel a bit more confident when they see a politician quoting figures on TV.
Show moreKoi
I picked this up thinking I’d get a deep dive into statistical methodology or maybe a guide on how to perform better analysis myself. That isn't what this is. Instead, the author provides what feels like a collection of essays on how not to be tricked by other people's data. To be fair, the ten rules are useful reminders to slow down and think, but the title is a bit misleading. It’s more about attitude than technique. I also found the conclusion about "curiosity" being the ultimate solution a bit thin. Telling me to just be more curious doesn't really help when I'm dealing with people who are flat-out resistant to facts, like the ones mentioned in the Philly DA example. It’s a decent read with some good stories, but it didn't quite hit the mark for what I was looking for.
Show morePat
Truth is, the book starts strong but hits a wall when it tries to solve the problem of human stubbornness. Harford is a great writer, and the stories about the hot sauce paradigm and counting sheep are genuinely entertaining. However, I found the advice on how to talk to data-resistant people to be pretty weak. He suggests asking people to elaborate on how they think something works, but in my experience, people who don't want to see the data will just ignore the question or get angry. There’s a bit of a disconnect between his high-level statistical rules and the messy reality of human psychology. It’s a good book for people who already want to think better, but I'm not sure it provides the answers for changing the minds of those who don't. Still, it’s worth reading for the historical anecdotes alone.
Show moreMint
Look, I usually enjoy Harford’s podcasts, but the political undertones here were way too heavy for a book that claims to teach objective statistical thinking. Right out of the gate, he starts berating people with labels like "Climate Denier," which felt like he was falling into the very emotional traps he warns us about later. The book felt like it could have been a long magazine article rather than a full-length book. Much of it is just common sense wrapped in nice anecdotes. If you’ve read any Kahneman or Adam Grant, you already know the core of what’s being said here. I was hoping for more specific tools on how to interpret complex data sets, but instead, I got a lot of handwaving about being curious. It wasn't a terrible read, but it definitely wasn't what I expected from the title.
Show moreQuestions about this book
What is the main idea of The Data Detective?
Tim Harford argues that statistics are neither to be swallowed whole nor dismissed. They are trustworthy once you check how a number makes you feel, ask what was counted and compared with what, look for who is missing from the data, and stay willing to change your mind. Without statistics, he points out, we would never have learned that smoking makes lung cancer 16 times more likely.
Why does Tim Harford say emotions matter when reading statistics?
Harford tells the story of Abraham Bredius, a leading Vermeer expert who in 1937 declared a forged painting genuine because he so badly wanted it to be real. Numbers work on us the same way: we reject claims that clash with our beliefs and seize on those that fit. Harford’s advice is to notice your reaction first, then ask whether you are straining toward a conclusion you already wanted.
How can I tell if a statistic is misleading?
Harford suggests a few questions. What exactly was counted, since British infant mortality gaps came down to how hospitals labeled very early births? What is the wider context, since one month of murders in London versus New York meant little next to decades of data? Who is missing from the sample? And does anyone gain from the number looking a certain way?
What are superforecasters in The Data Detective?
Superforecasters are the people Philip Tetlock found in a study of 20,000 experts and amateurs who predicted better than average and kept improving over time. Tetlock’s earlier study of about 27,500 predictions from almost 300 experts showed most were wrong and overconfident. The superforecasters stood out for open-mindedness: they did not cling to one approach and changed their views when new evidence arrived.
What are landmark numbers and how do I use them?
Entrepreneur Andrew Elliott, cited in the book, recommends memorizing a few reference figures, such as a US population of 325 million, a UK population of 65 million, and an average novel length of 100,000 words. With these in mind, other numbers become easier to judge. A 10,000-word report sounds long, for example, until you see it is a tenth of a typical novel.
Readers also enjoyed
Age of Propaganda: The Everyday Use and Abuse of Persuasion
Anthony Pratkanis

Adults in The Room: My Battle With Europe’s Deep Establishment
Yanis Varoufakis
AUDIO SUMMARY AVAILABLE
Listen to The Data Detective in 15 minutes
Get the key ideas from The Data Detective by Tim Harford, plus 5,000+ more nonfiction titles.
- 5,000+ titles
- Listen as much as you want
- 7-day free trial
- Cancel anytime