A Thousand Brains: A New Theory of Intelligence
Jeff Hawkins
 English
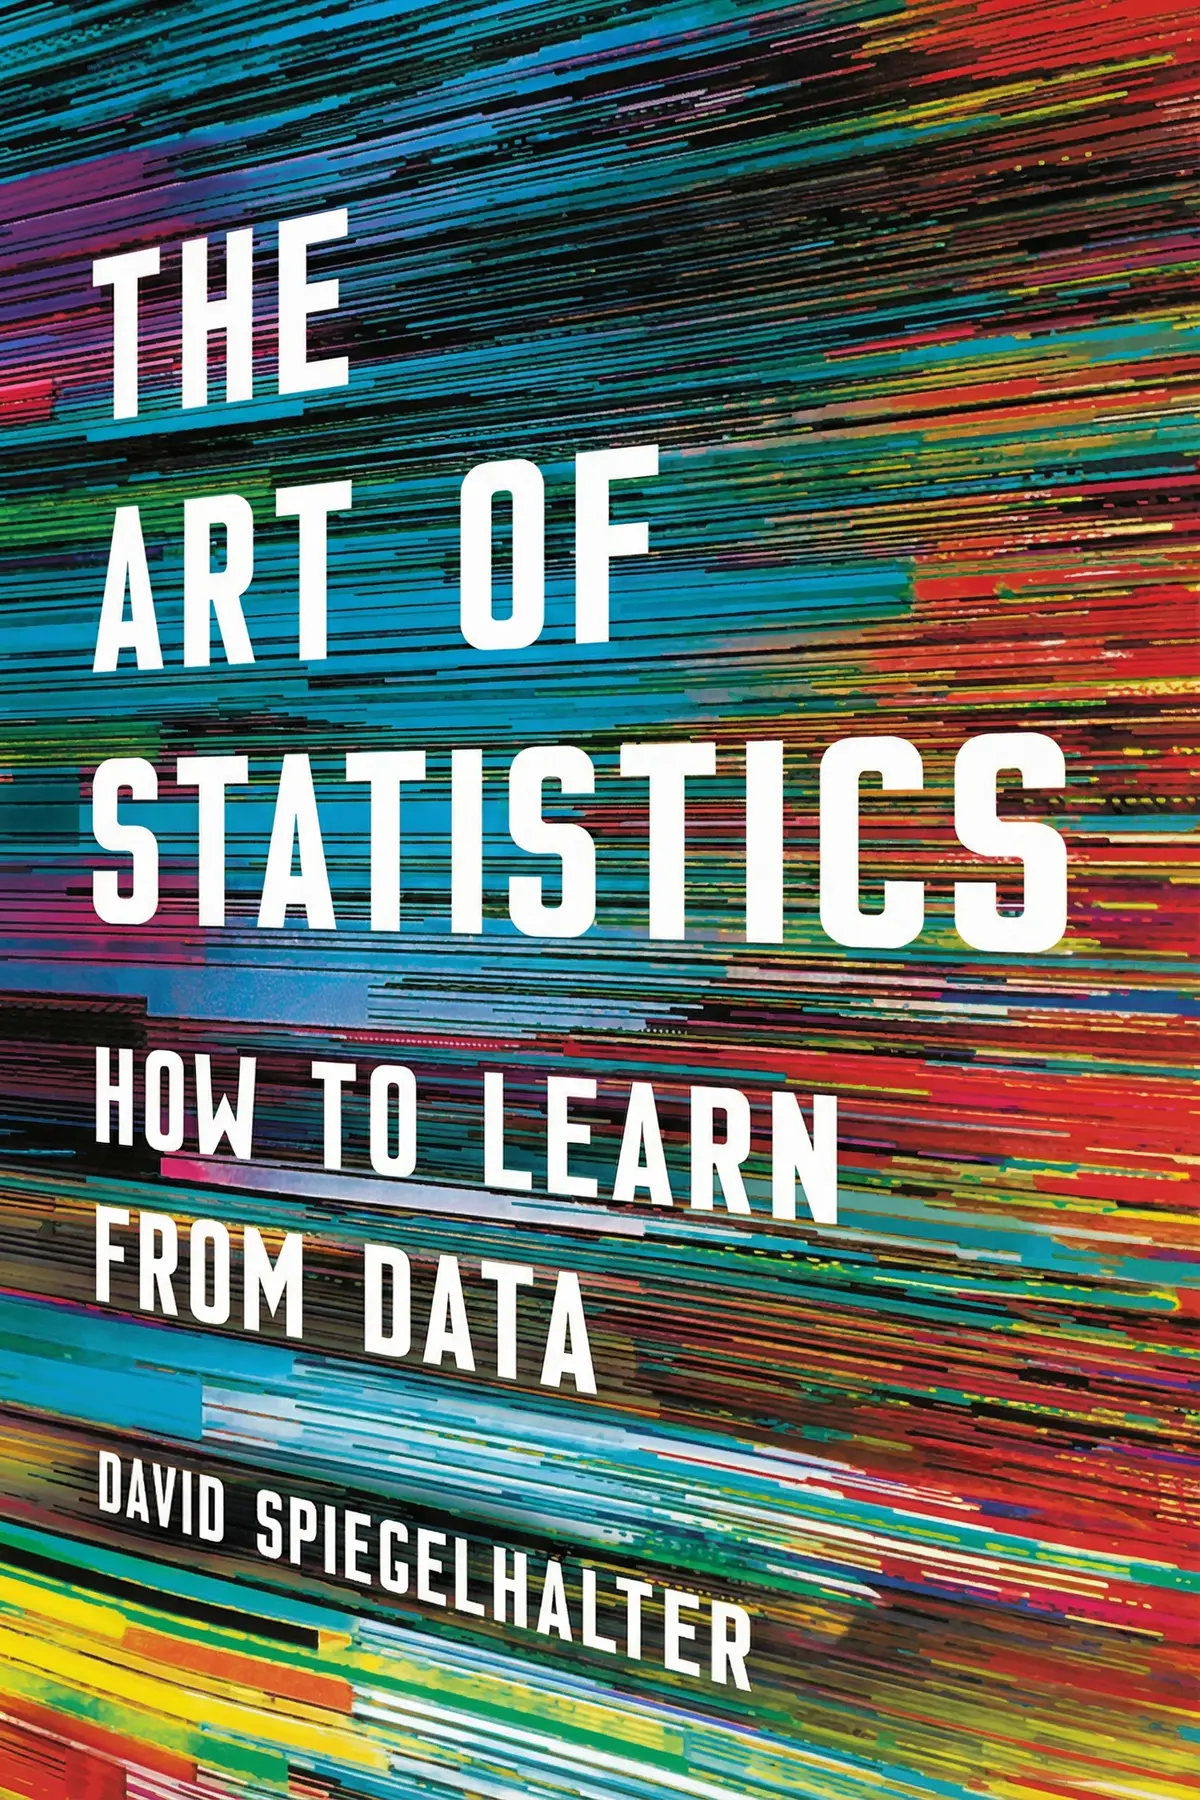
Shows how numbers get bent between the lab and the headline, and gives you plain tests for survey wording, risk claims, averages, correlations and probabilities so you can judge the statistics thrown at you.
59 sec
Most of us meet statistics as headlines telling us what to fear, eat or believe, and we have no way to sort a sound figure from a shaky one. In The Art of Statistics, Cambridge statistician David Spiegelhalter shows that this skill can be learned, and that it can save lives. His report found that watching death records could have exposed the British doctor Harold Shipman fifteen years before his arrest.
His argument is that numbers never reach us raw. People choose what to count, what to ask, how to draw it, what to publish and how to headline it, and each step can bend the figure. If you know where the bending happens, you can judge a claim instead of simply accepting it. The tools come with memorable cases: a dead fish that seemed to read human faces, a meat scare that shrinks to about one percent, and a coin question that most members of a parliament got wrong.
1 min 39 sec
A family doctor killed hundreds of patients while the evidence sat in ordinary paperwork. The way a statistician later read those records gives you a five-step method for turning any worry into something numbers can answer.
1 min 44 sec
An airline said 92 percent of its passengers were satisfied, and a crime figure nearly doubled in three years. Neither number was invented, yet both misled, for reasons that begin before anyone does any math.
1 min 35 sec
Two charts can show identical data and leave viewers with opposite feelings. A reassuring poster on the London Underground shows how one change of wording turns comfort into alarm.
1 min 38 sec
A brain scan once showed a dead fish responding to human emotions. The researchers behind it were making a serious point about how science reports discoveries, and about the results that never get published.
1 min 31 sec
Eating processed meat raises bowel cancer risk by 18 percent, the headlines said, and the figure was correct. One missing piece of context changes how worried you should actually be.
1 min 31 sec
Most people have more legs than average, and the joke is technically true. The same trick makes many reported figures describe almost nobody, and the media rarely tells you it is happening.
1 min 38 sec
Cheese eating and engineering degrees once rose in step, and moderate drinkers seem to outlive people who never drink. Before you believe any link like these, there are three other explanations worth ruling out.
1 min 43 sec
Most members of a national parliament fumbled a simple question about two coin flips. A cancer screening example shows how far intuition can drift, and why chaos at a small scale still produces steady patterns.
1 min 05 sec
Spiegelhalter’s book works as a map of the places where numbers get bent before they reach you. A figure begins when someone decides what counts as a tree or a crime. It passes through a survey’s wording and a designer’s chart. It gets past journals that prefer exciting results. Finally it reaches a headline writer who wants drama. It can drift at every step, usually without anyone lying. The patient work that found Shipman’s afternoon deaths can catch those drifts too.
None of this means you should distrust every number. Spiegelhalter suggests treating statistics the way you treat your friends: wonderful sources of stories, but not always the most accurate. When a risk alarms you, ask what it was to begin with. When someone describes the typical person, ask which kind of average they used. Whenever you can, follow the headline back to its source.
A dead salmon once lit up on a brain scan. The sensible response, then and now, is to ask how many tests were run.
Statistics now appear everywhere: in political campaigns, advertisements and news feeds. More and more, they are used to persuade people instead of informing them. Many of the people producing these figures have little statistical training, and errors can creep in at any stage, from flawed research to careless reporting. David Spiegelhalter is a Cambridge statistician who worked on the inquiry into the serial killer Harold Shipman, and he argues that reading data is now an everyday skill. He follows a number through its whole life. He looks at the choices behind what gets counted, the wording of survey questions and the design of charts. He also looks at the way journals favor exciting results and the media's taste for drama. Along the way he explains the difference between relative and absolute risk and why the mean can mislead. He gives three explanations to rule out before deciding that a correlation proves a cause, and he shows why a positive screening test can mean far less than it seems. Readers get a set of simple questions to ask of any statistic. They also learn when numbers deserve trust, such as the long-run patterns that make statistics a kind of social physics.
Professionals who read reports, dashboards and surveys and want to tell solid figures from shaky ones.
Students and early-career analysts who know the formulas but not the traps around them.
Anyone tired of health scares who wants simple questions to ask of any number in the news.
Sir David Spiegelhalter is a British statistician and a fellow of Churchill College, Cambridge. In 2007 he became Winton Professor of the Public Understanding of Risk there, and he has chaired the Winton Centre for Risk and Evidence Communication. His background is in medical statistics with a focus on Bayesian methods, and he worked with the team that developed the BUGS software for Bayesian analysis. He led the statistical team for the Bristol Royal Infirmary Inquiry and gave evidence to the Shipman Inquiry. He was president of the Royal Statistical Society in 2017 and 2018.
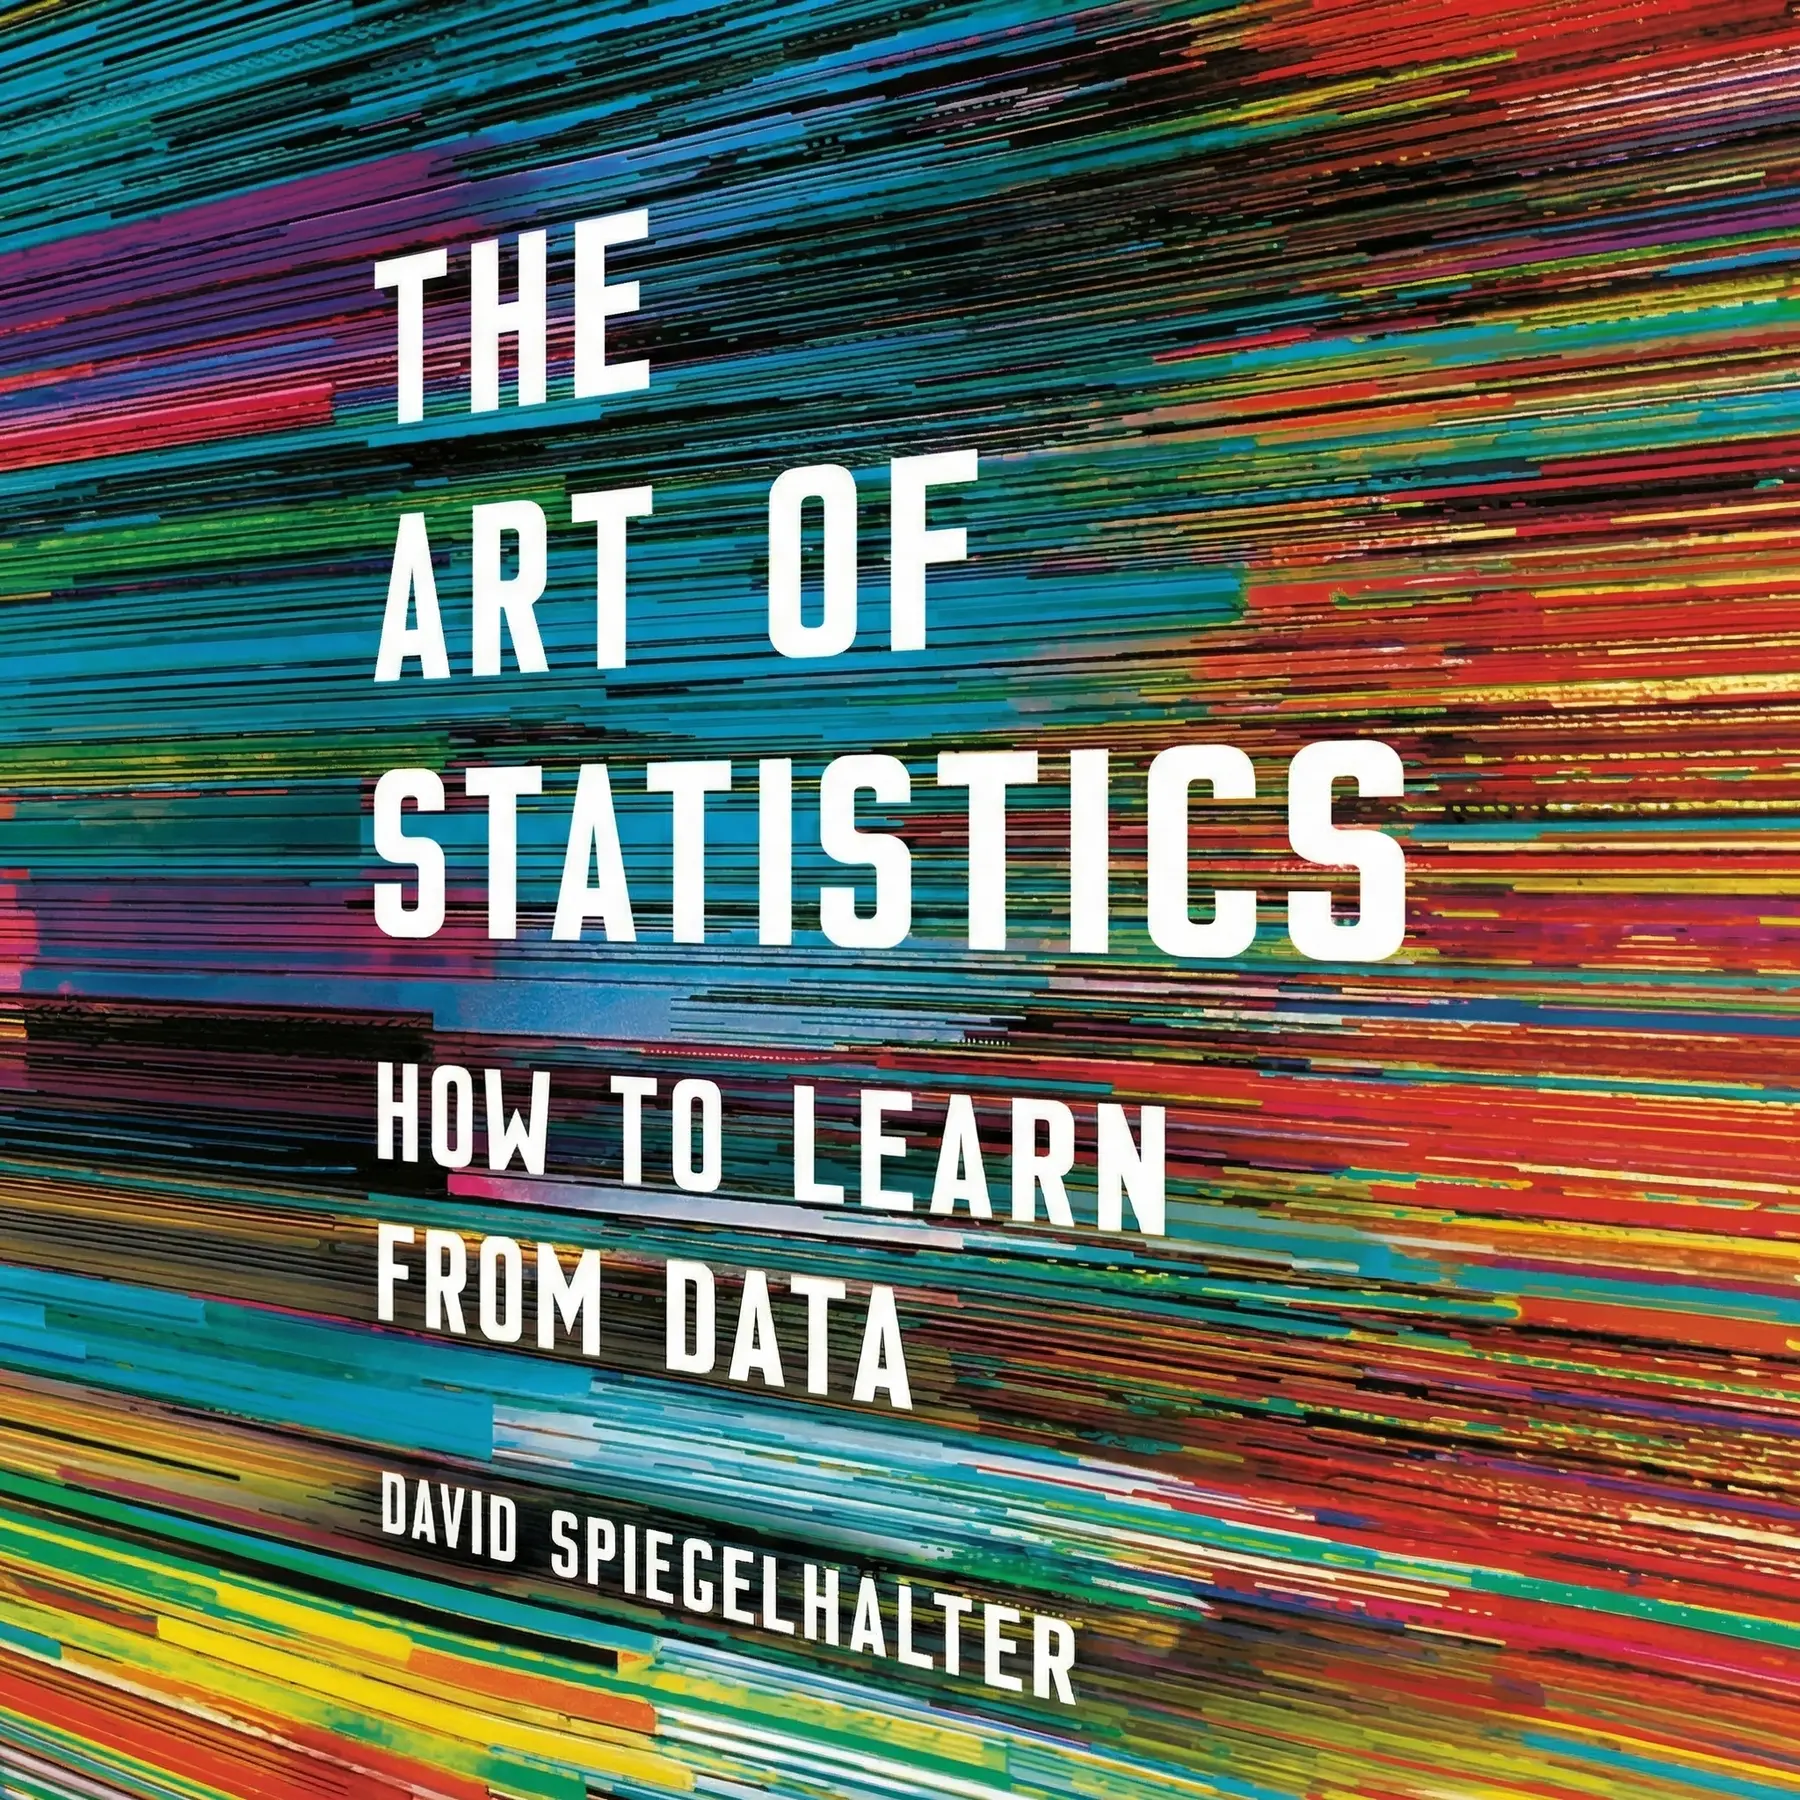
Listeners find this book valuable for deepening their knowledge of statistical methods, featuring transparent descriptions of a diverse array of topics. The prose is commended, and one listener observes that it is obviously tailored for a general readership. They enjoy the book's visual elements, with one individual noting that it provides good diagrams.
Ever wonder how a serial killer like Harold Shipman managed to evade detection for so long? Spiegelhalter uses this chilling case to show how data—if properly monitored—could have saved hundreds of lives. The book is a masterclass in statistical reasoning for the layperson, avoiding the typical swamp of complex formulas. I particularly loved the visualisations; they turn abstract concepts into something you can actually see and grasp. While some chapters on probability get a bit dense, the narrative remains engaging throughout. It’s rare to find a professor who can communicate this effectively without condescension. This isn't just a textbook; it’s a guide to thinking more clearly about the world around us. A must-read for anyone who feels intimidated by numbers.
Show moreThe Art of Statistics makes a potentially dry subject feel incredibly alive and urgent. Spiegelhalter doesn’t just teach you math; he teaches you how to spot when you're being lied to by the media. I found the section on the 'Prosecutor’s Fallacy' absolutely fascinating and it completely changed how I look at court cases. The graphics are decent and actually help illustrate the points rather than just being filler. Frankly, I think this should be required reading in schools given how much data we consume daily. Even the more complex parts, like supervised learning, are handled with a gentle touch. It feels like a conversation with a very smart, very patient friend.
Show moreSpiegelhalter has a real gift for taking obscure academic theories and rooting them in things people actually care about. From the survival rates of the Titanic to the likelihood of finding Richard III in a parking lot, the examples are top-notch. I appreciated that he didn't shy away from the ethics of data science, especially the discussion on the replication crisis. The book is beautifully packaged and the tone is incredibly welcoming. It’s refreshing to see a statistician admit when things are complicated or when a simple answer doesn't exist. This isn't just about numbers; it's about the stories we tell with them. Highly recommended for the curious mind.
Show moreWow, a statistics book that actually prioritizes intuition over memorizing grueling formulas. The way Spiegelhalter dismantles sensationalist headlines about health risks is both brilliant and necessary. He shows us how a simple change in framing can turn a reassuring stat into a terrifying one. I’ve been recommending this to everyone in my office because it helps clarify how to present data ethically. The sections on probability theory were particularly eye-opening for me. Even though I’m fairly comfortable with numbers, I still learned plenty of new ways to think about risk. It’s a masterfully written piece of science communication that deserves all the praise it gets.
Show moreGotta say, this is probably the most readable book on statistics I’ve ever encountered. The author’s passion for the subject shines through on every page, especially when discussing how stats can improve public policy. I loved the quirky questions, like why old men have big ears, which serve as perfect entry points into more serious discussions about correlation and causation. The graphs are clear and help bridge the gap where the math is omitted. It’s a very human look at a field often dismissed as cold or robotic. If you’ve ever felt like statistics were a foreign language, Spiegelhalter is the perfect translator. It’s a brilliant achievement in science writing.
Show moreFinally got around to reading this after seeing Spiegelhalter’s lecture online. He writes with a clarity that is quite rare in the field of mathematics. The chapter on Bayesian statistics was the highlight for me, as it’s usually presented in such a confusing way elsewhere. Truth is, I did feel a bit of 'intellectual whiplash' at times when the text jumped from casual anecdotes to very dense sections. One minute you're learning why old men have big ears, and the next you're navigating the replication crisis. However, the inclusion of a technical glossary at the end allows the main text to flow much better. It’s a solid 4 stars for being both informative and genuinely entertaining.
Show moreAs someone who struggled through college stats, I found this refreshing yet occasionally challenging. The author avoids the 'gotcha' problems found in most textbooks and focuses instead on real-world applications. Personally, I found the chapter on regression models particularly useful for my own work. My only gripe is that it sometimes tries to be all things to all people, which results in some shallow sections. For instance, the definition of supervised learning felt a bit off and lacked the depth needed for a proper understanding. Still, the overall message about statistical literacy is vital. It’s a great companion to more technical books if you need the 'why' behind the 'how'.
Show moreLook, we live in a world drowning in data, and this book acts as a much-needed life jacket. Spiegelhalter explains complex ideas like p-values and confidence intervals without making my head spin too much. I loved the breakdown of Simpson’s Paradox; it’s one of those 'aha!' moments that stays with you. The writing style is conversational, though some sections definitely require a pen and paper to fully digest. It’s not exactly a beach read, but it’s far more accessible than your average university tome. I wish there were more examples related to digital analytics, but that’s a minor personal preference. It's an insightful look at a misunderstood field.
Show moreThe physical dimensions of this book are surprisingly small, but the content varies wildly in difficulty. One moment you're reading a light anecdote about coin flips, and the next you're plunged into the depths of Bayesian inference. I found myself frequently losing the thread because the structure felt a bit haphazard. While the examples—like the Harold Shipman case—are genuinely interesting, the transition between topics can be jarring. I also felt the author sometimes gave up on explaining the harder bits, essentially telling the reader to just move on. It’s an okay introduction, but I think it needed to be longer to really do these topics justice. Not bad, just inconsistent.
Show moreTo be fair, I expected a much more structured approach to statistical techniques. Instead, the book feels scattered, hopping from data science to machine learning with no apparent logical flow. The author tends to hand-wave the actual mechanics of the math by saying 'software handles it,' which left me feeling like I didn't actually learn how things work. If you want a deep dive into the nitty-gritty, you won't find it here. The physical book is also tiny, making it feel like it's trying to be a 'pop science' hit rather than a comprehensive guide. I found Charles Wheelan’s Naked Statistics much more intuitive and better organized for a beginner. Quite disappointing.
Show moreDavid Spiegelhalter argues that statistics can answer real questions about the world, but every number passes through human choices on its way to us. People decide what to count, how to word questions, how to draw charts, what journals publish and how the media frames results. Each step can distort the figure. Learning where those distortions happen lets ordinary readers judge the statistics used in news, advertising and politics.
Relative risk tells you how much a risk grows compared with where it started. Absolute risk tells you the actual chance. Spiegelhalter’s example is a World Health Organization finding that regularly eating processed meat raises bowel cancer risk by 18 percent. The starting risk was 6 percent, so the risk rises to 7.08 percent. The real increase is only about one percentage point, which is far less alarming than the headline number.
Two things can move together without one causing the other. Spiegelhalter gives three explanations to check. The link may be coincidence, like mozzarella eating tracking engineering doctorates. The cause may run the other way, as when ill people avoid alcohol and make non-drinkers look less healthy. Or a hidden factor may drive both, as the weather probably drives both ice-cream sales and drownings.
It suits anyone who meets numbers at work or in the news and wants to judge them, without needing advanced math. Professionals who rely on surveys and dashboards, students learning statistics, and readers worried by health headlines all benefit. Spiegelhalter uses real cases, from the Harold Shipman inquiry to a misleading airline survey, so the ideas stay concrete.
Treat statistics like a friend’s stories: often valuable, not always accurate. Check the exact survey question and the answers people were allowed to give. Restate a striking figure both ways, as the opposite percentage and as a raw count. Ask for the starting level whenever a risk rises, and ask which average is being used. Rule out chance, reverse causation and hidden factors, and trace headlines back to their sources.
Jeff Hawkins

Lisa Kaltenegger

J. Craig Venter
AUDIO SUMMARY AVAILABLE
Get the key ideas from The Art of Statistics by David Spiegelhalter, plus 5,000+ more nonfiction titles.